Background
The Bawku West District lies within the Upper East Region of Ghana. It was carved out of the old Bawku District under the new local government system in 1988. It lies roughly between latitudes 10° 30’N and 11° 10’N, and between longitudes 0° 20’E and 0° 35’E. The district shares boundaries with Burkina Faso in the North, Binduri District to the East, Talensi and Nabdam District to the West and East Mamprusi District to the South. Two important tributaries of the Volta River namely the White and Red Volta ran contiguous to the Districts’ Eastern and Western boundaries respectively. The district covers an area of approximately 1,070 square kilometres, which constitutes about 12% of the total land area of the Upper East Region. It is the biggest district in the Upper East Region in terms of land area
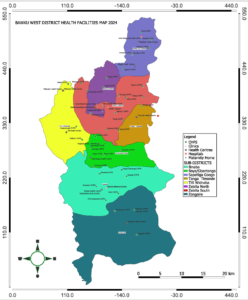
Map of Bawku West District

Population size, structure and composition
The population of Bawku West District, according to the GHS-PPMED projection, the district population for 2024 is 154135. Males constitute 48.8 percent and females represent 51.2 percent of the district’s population. About ninety (90.8%) percent of the population is rural. The district has a sex ratio (number of males to 100 females) of 92.2. The population of the district (less than 15 years) is youthful (45.1%) depicting a broad base population pyramid which tapers off with a small number of elderly (65 years and older) persons (6.9%). The total age dependency ratio for the district is 108.6, and the child dependency ratio is higher (94) than the old age dependency ratio (14.4).
Fertility, mortality and migration
The Total Fertility Rate (TFR) for the district is 3.7. The General Fertility Rate (GFR) is 106.2 births per 1000 women aged 15-49 years which is the second highest for the region. The Crude Birth Rate (CBR) is 23.7 per 1000 population. The crude death rate for the district is 8.9 per 1000. The death rate for males is highest for age 70 and older representing about 58 deaths per 1000 population while for females; the highest death rate of 34 deaths per 1000 population is for the same age category. Accident/violence/homicide/suicide accounted for 5.1 percent of all deaths while other causes constitute 94.9 percent of deaths in the district. The majority of migrants (55.3 percent) living in the district were born in another region while 44.7 percent were born elsewhere in the Upper West Region. For migrants born in another region, those born in Ashanti constitute 60.8 percent followed by Western Region with 11.2 percent and Brong Ahafo, 9.4 percent.
Health Facility
The district has 58 facilities with 57 currently in DHIMS 2 (one new private facility operationalized towards the end of the first quarter of the year). 1 district hospital, 37 facilities are CHPS, 9 Health Centres, 1 CHAG facility, and 8 private facilities.
Household Size, composition and structure
Marital Status
About half (52.2%) of the population aged 12 years and older are married, 36.0 percent have never married, 0.2 percent are in consensual unions, 9.2 percent are widowed, 1.5 percent are divorced and 1.0 percent are separated. By age 25-29 years, more than three-quarters of females (85.3%) are married compared to a little above two in ten of males (24.4%). At age 65 and above, widowed females account for as high as 61.8 percent while widowed males account for only 10.0 percent. Among the married, 81.7 percent have no education while about 25.8 percent of the unmarried have never been to school. More than three-quarters of the married population (88.5%) are employed, 0.9 percent are unemployed and 10.6 percent are economically not active. A greater proportion of those who have never married (45.5%) are economically not active with 1.0 percent unemployed.
Nationality
The proportion of Ghanaians by birth in the district is 94.0 percent. Those who have naturalised constitute 1.0 percent and the non-Ghanaian population in the district is 2.4 percent.
Literacy And Education
Of the population 11 years and above, 39.0 percent are literate and 61.0 percent are nonliterate. The proportion of literate males is higher (48.0 %) than that of females (31.0%). A little less than two out of ten people (16.9%) indicated they could speak and write both English and Ghanaian languages. Of the population aged 3 years and older who are currently attending school (32,652) in the district, 59.9 percent are in primary school, 13.3 percent are JSS/JHS, of those who have attended school in the past, 50.4 percent have attended primary school and 17.5 percent have attended JSS/JHS.
Economic activity status
About 79.0 percent of the population aged 15 years and older are economically active while 21.0 per cent are economically not active. Of the economically active population, 98.6 percent are employed while 1.4 percent are unemployed. For those who are economically not active, a larger percentage of them are students (36.6%), 26.0% perform household duties and 6.8 percent are disabled or too sick to work. About half (49.0%) unemployed are seeking work for the first time.
Occupation
Of the employed population, 81.0 percent are engaged as skilled agricultural, forestry and fishery workers, 6.1 percent in service and sales, 6.9 percent in craft and related trade, and 2.9 percent are engaged as managers, professionals, and technicians.
Employment status and sector
Of the population 15 years and older 70.4 percent are self-employed without employees, 20.9 percent are contributing family workers, 0.5 percent are casual workers and 0.6 percent are domestic employees (house helps). Overall, men constitute the highest proportion in each employment category except the contributing family workers and apprentices. The private informal sector is the largest employer in the district, employing 96.2 percent of the population followed by the public sector with 2.7 percent.
Information and communication technology
Of the population 12 years and above, 17.6 percent have mobile phones. Men who own mobile phones constitute 24.6 percent as compared to 11.6 percent of females. A little less than one percent of the population 12 years and older use internet facilities in the district. Only 203 households representing 1.3 percent of the total households in the district have desktop/laptop computers.
DIsability
About 4.2 percent of the district’s total population has one form of disability or the other. The proportion of the male population with a disability is the same as (4.2%) that of females (4.2%). The types of disability in the district include sight, hearing, speech, physical, intellect, and emotion. Persons with sight disability recorded the highest of 37.6 percent followed by hearing disability (21.6%). About 93.2 percent of the population with disability are in rural localities. There are slightly more females with sight, and hearing disabilities than males in both the urban and rural localities. Of the population disabled, 75.4 percent have never been to school and 41.2 percent are economically not active.
Agriculture
As high as 93.3 percent of households in the district are engaged in agriculture. In the rural localities, 96.5 percent of the total number of households are agricultural households while in the urban localities, 68.4 percent of households are in agriculture. Most agricultural households in the district (98.1%) are involved in crop farming. Chicken and guinea fowl are the dominant animals reared in the district
Housing
The housing stock of Bawku West District is 11,284 representing 9.9 percent of the total number of houses in the Upper East Region. The average number of persons per house is 8.2.
Type, tenancy arrangement and ownership of dwelling units
Less than half (47.7%) of all dwelling units in the district are compound houses; 24.7 percent are huts buildings in the same compound, 21.2 percent are separate houses and 4.2 percent are huts buildings in different compounds. More than nine out of ten (91.5%) of the dwelling units in the district are owned by members of the household; 3.5 percent are owned by private individuals; 3.5 percent are owned by a relative who is not a member of the household and only 1.2 percent are owned by public or government. Less than one percent (0.1%) of the dwelling units are owned through mortgage schemes.
Material for the construction of an outer wall, floor and roof
The main construction material for outer walls of dwelling units in the district is mud/mud bricks or earth accounting for 92.9 percent with cement/concrete constituting 4.3 percent of outer walls of dwelling units in the district. Cement (58.3%) and mud/earth (39.8%) are the two main materials used in the construction of floors of dwelling units in the district. Metal sheets are the main roofing material (61.6 %) for dwelling units in the district.
Room Occupancy
One room constitutes the highest percentage (45.6%) of sleeping rooms occupied by households in housing units in the district. About 0.1 percent of households with 10 or more members occupy single rooms.
Utilities and household facilities
The three main sources of lighting in dwelling units in the district are flashlight/torch (43.1%), kerosene lamp (39.8%) and electricity (14.3%). The main source of fuel for cooking for most households in the district is wood (80.2%). The proportion for rural (83.8%) is higher than that of urban (52.0%). The four main sources of water in the district are boreholes, protected wells, unprotected wells, and pipe-borne outside dwellings. More than half of households (65.2%) drink water from boreholes. The most important toilet facility used in the district is KVIP, constituting 6.6 percent followed by pit latrine (3.1%). About 86.3 percent of the population in the district has no toilet facility. About four out of ten households (33.4%) in the district share separate bathrooms in the same house while 33.6 percent own bathrooms for their exclusive use.
Waste Disposal
The most widely method of solid waste disposal is by burning solid waste, accounting for 29.6 percent, followed by public dumping in the open space representing 18.3 percent. About one in ten households (11.3%) dump their solid waste indiscriminately. House-to-house waste collection accounts for 12.0 percent. For liquid waste disposal, throwing waste onto the compound (47.5%) and onto the street (39.1%) are the two most common methods used by households in the district.
Transport
About 20% of the population relies on motorcycles for transport. The Administrative capital, Zebilla has the majority of the population utilizing tricycles (Pragia) with the other communities relying on Motorking tricycles. Except for the principal street (Bolga-Zebilla-Bawku Road) which is tarred, the rest are not which poses a serious threat during the peak rainy seasons of the year making access to health care, markets and other amenities a bit difficult.


